
What is Causality?
To understand causality, let's bring it to life with a classic example: the cockerel and the sunrise. Does the Cockerel Crowing Cause the Sun to Rise?
Let's imagine that we record the time every day when the sun rises and whether or not the cockerel crows. Looking at this data, we would observe a high correlation between the sun rising and the cockerel crowing but just observing this pattern wouldn't tell us what causes what.
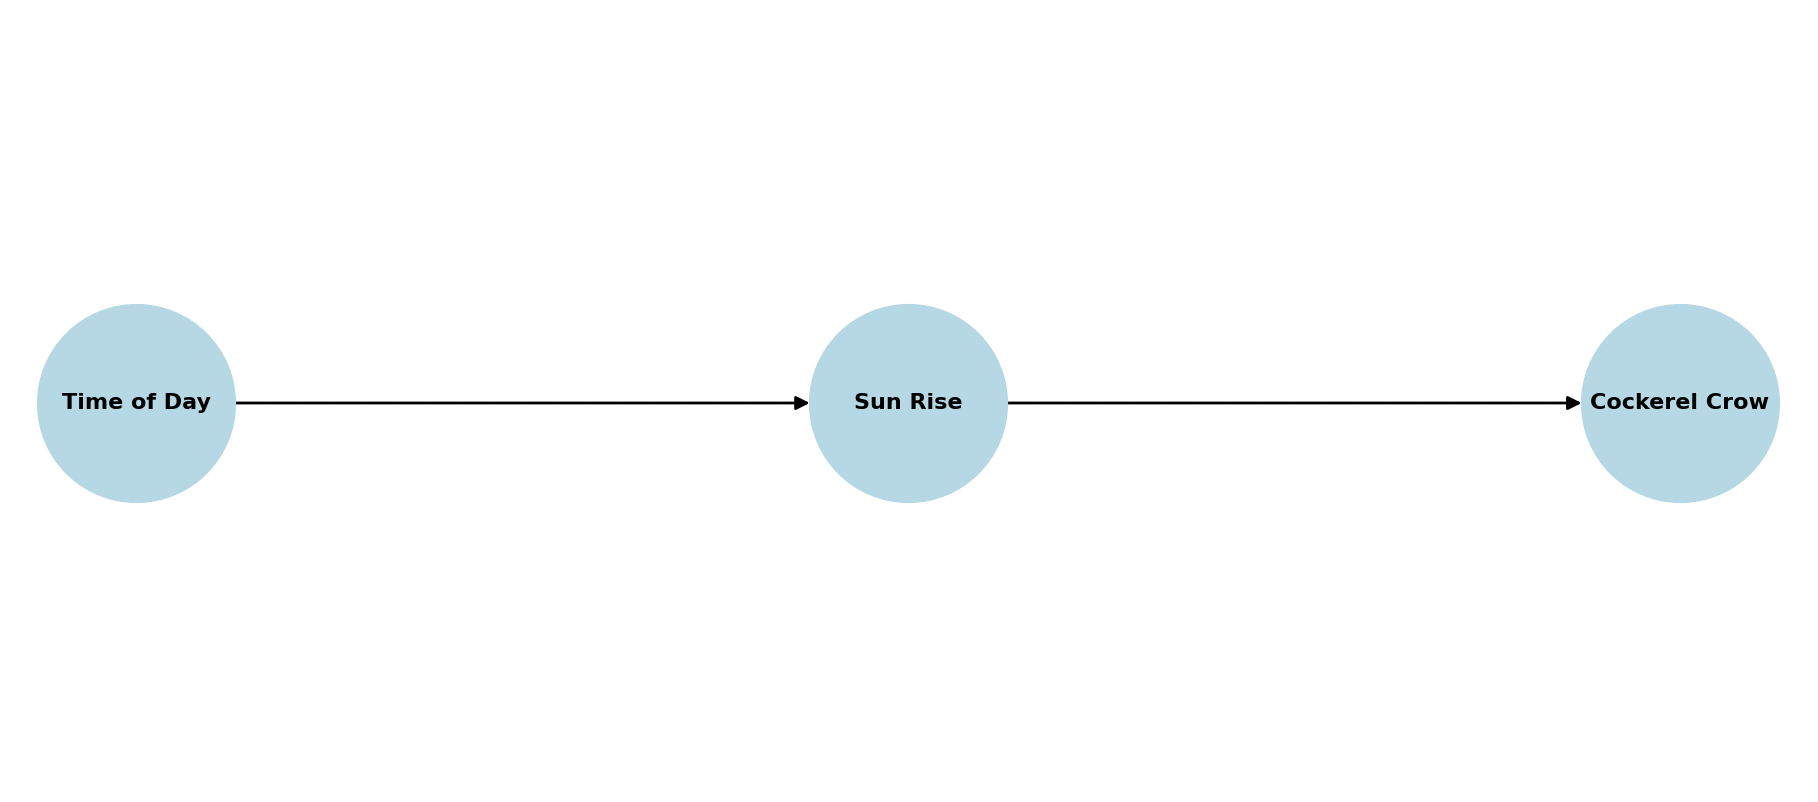
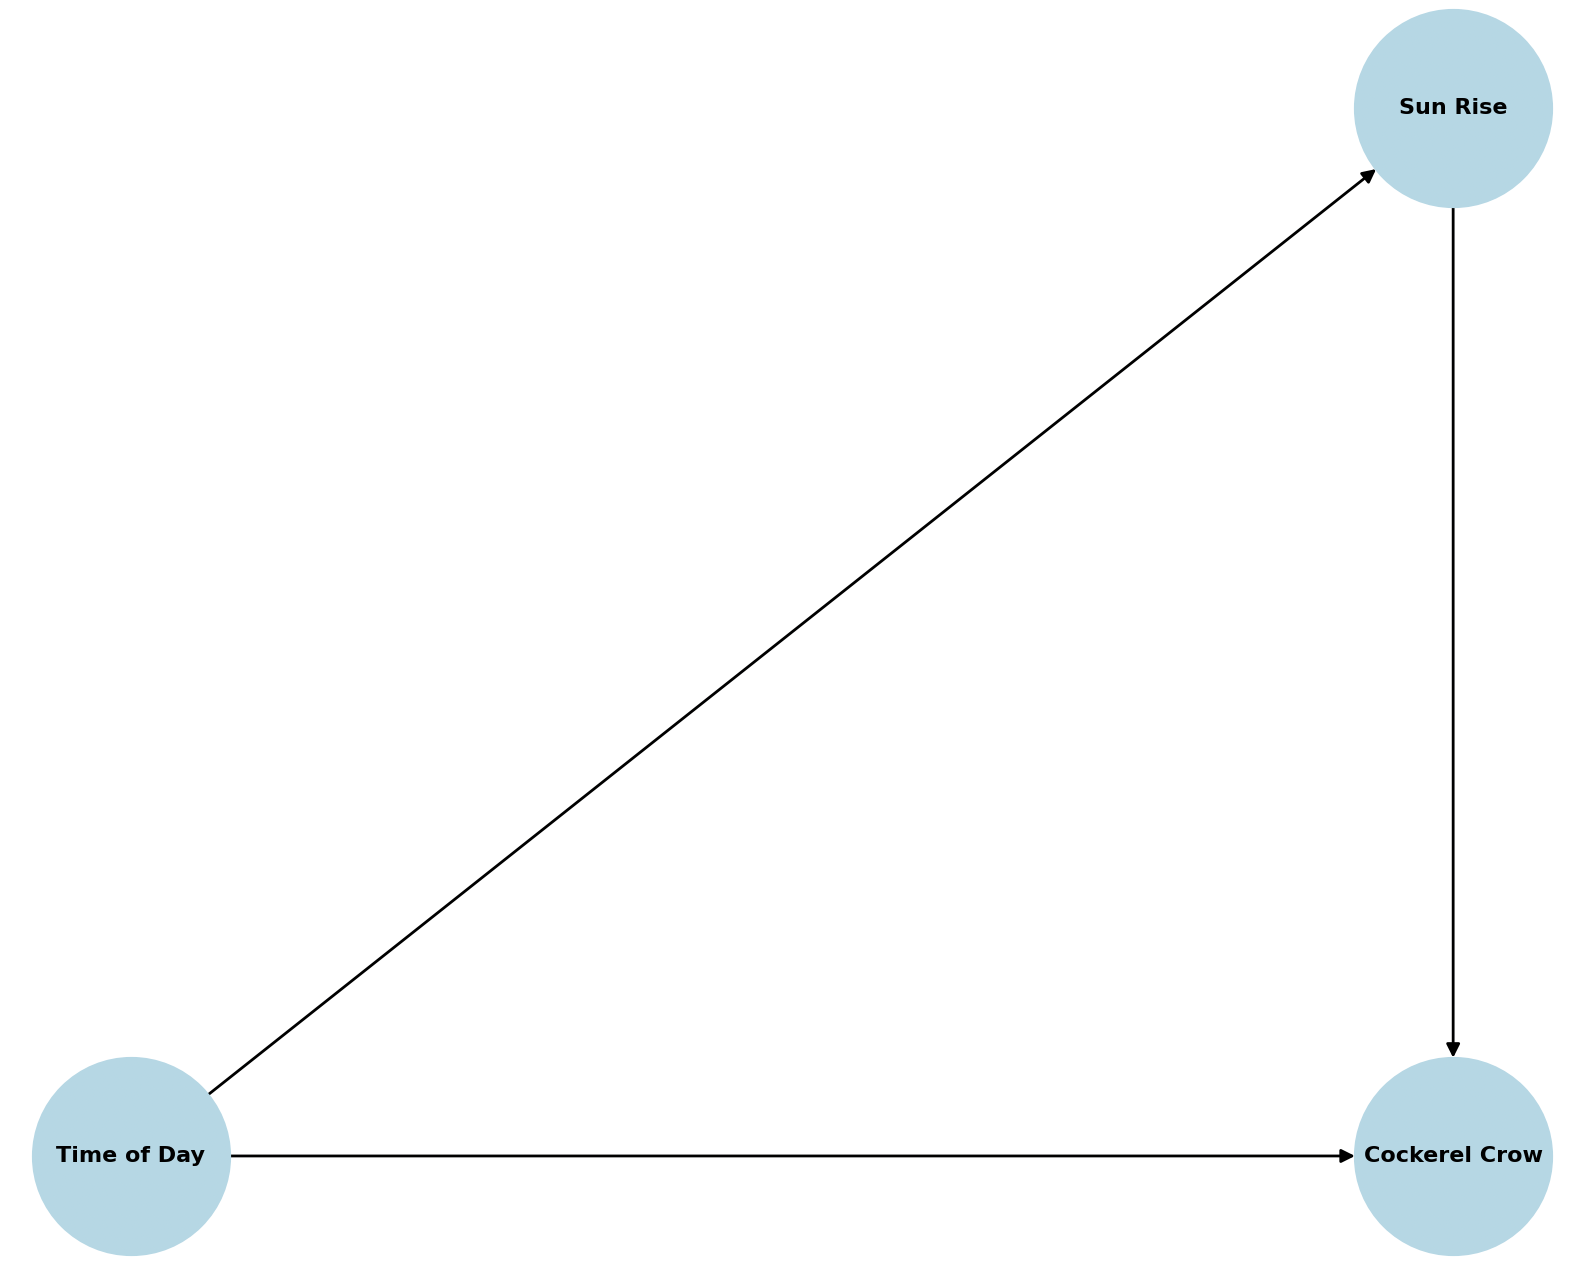
Causality describes the act of going one step further than correlation - understanding the truth of the world. As humans, we know that the time of day causes the sun to rise, which then causes the cockerel to crow. This is our causal graph of the world, constructed over thousands of years of observing sunrises.
We have developed an intuitive understanding that time influences the sun, and the sun influences the cockerel—not the other way around.
Why is Causality Important?
Understanding causality is fundamental to decision-making, science, and AI. If we instead believed that the cockerel crowing causes the sun to rise then our whole approach to life would be completely different! Similarly, knowing whether discounts or bug fixes actually cause customer acquisition can completely change our approach to business.
While correlation can reveal patterns, only causality allows us to predict outcomes, make informed decisions, and take effective actions.
What is Causal Discovery?
Causal discovery refers to the art of extracting causal graphs using data. Recently, numerous research teams and companies, including Microsoft and DataCanvas, have been developing methods to perform causal discovery purely from data. The goal is to enable machines to learn these causal relationships autonomously, just as humans have done over centuries.
Why is Causal Discovery from Data Difficult?
Extracting causality from data is challenging because correlation does not imply causation. Let’s revisit our cockerel example. Suppose we construct a dataset where:
- Time of day is an independent variable.
- If time is later than 6 AM, the sun rises.
- If the sun rises, there is a 90% chance the cockerel will crow.
n = 1000  # Number of observations
np.random.seed(42)
time_of_day = np.random.uniform(4, 8, n)  # Time in hours (e.g., between 4 AM and 8 AM)
sun_rises = (time_of_day >= 6).astype(int)  # Sun rises at 6 AM

# Cockerel crows if sun rises (with some noise)
cockerel_crows = sun_rises * (np.random.rand(n) > 0.1).astype(int)  # 90% chance to crow if sun rises

# Create DataFrame
df = pd.DataFrame({
    "Sun_Rises": sun_rises,
    "Cockerel_Crows": cockerel_crows,
    "time_of_day": time_of_day,
})

df.to_csv("cockerel.csv", index=False)
From our 1,000 samples, the cockerel crows in 90% of cases.
But here’s the fundamental problem:
How do we know if the sun rising causes the cockerel to crow or if the cockerel causes the sun to rise, based on data alone?
Testing Causal Discovery with Existing Libraries
Let’s try the YLearn library from DataCanvas , which claims to be able to perform causal discovery.
# Import ylearn and relevant plotting libraries
from ylearn.exp_dataset.gen import gen
from ylearn.causal_discovery import CausalDiscovery
import networkx
import matplotlib.pyplot as plt


# Read in data
X = pd.read_csv("cockerel.csv")

# ylearn causal discovery
cd = CausalDiscovery(hidden_layer_dim=[3])
est = cd(X, threshold=0.01, return_dict=True)

G = nx.DiGraph()

# Add edges based on the dictionary
for parent, children in est.items():
    for child in children:
        G.add_edge(child, parent)  # Reverse the direction based on the given format

# Draw the graph
plt.figure(figsize=(6, 4))
pos = nx.spring_layout(G)  # Auto-layout for better visualization
nx.draw(G, pos, with_labels=True, node_color="lightblue", edge_color="black",
        node_size=5000, font_size=10, font_weight="bold", arrows=True)

# Show the causal graph
plt.show()
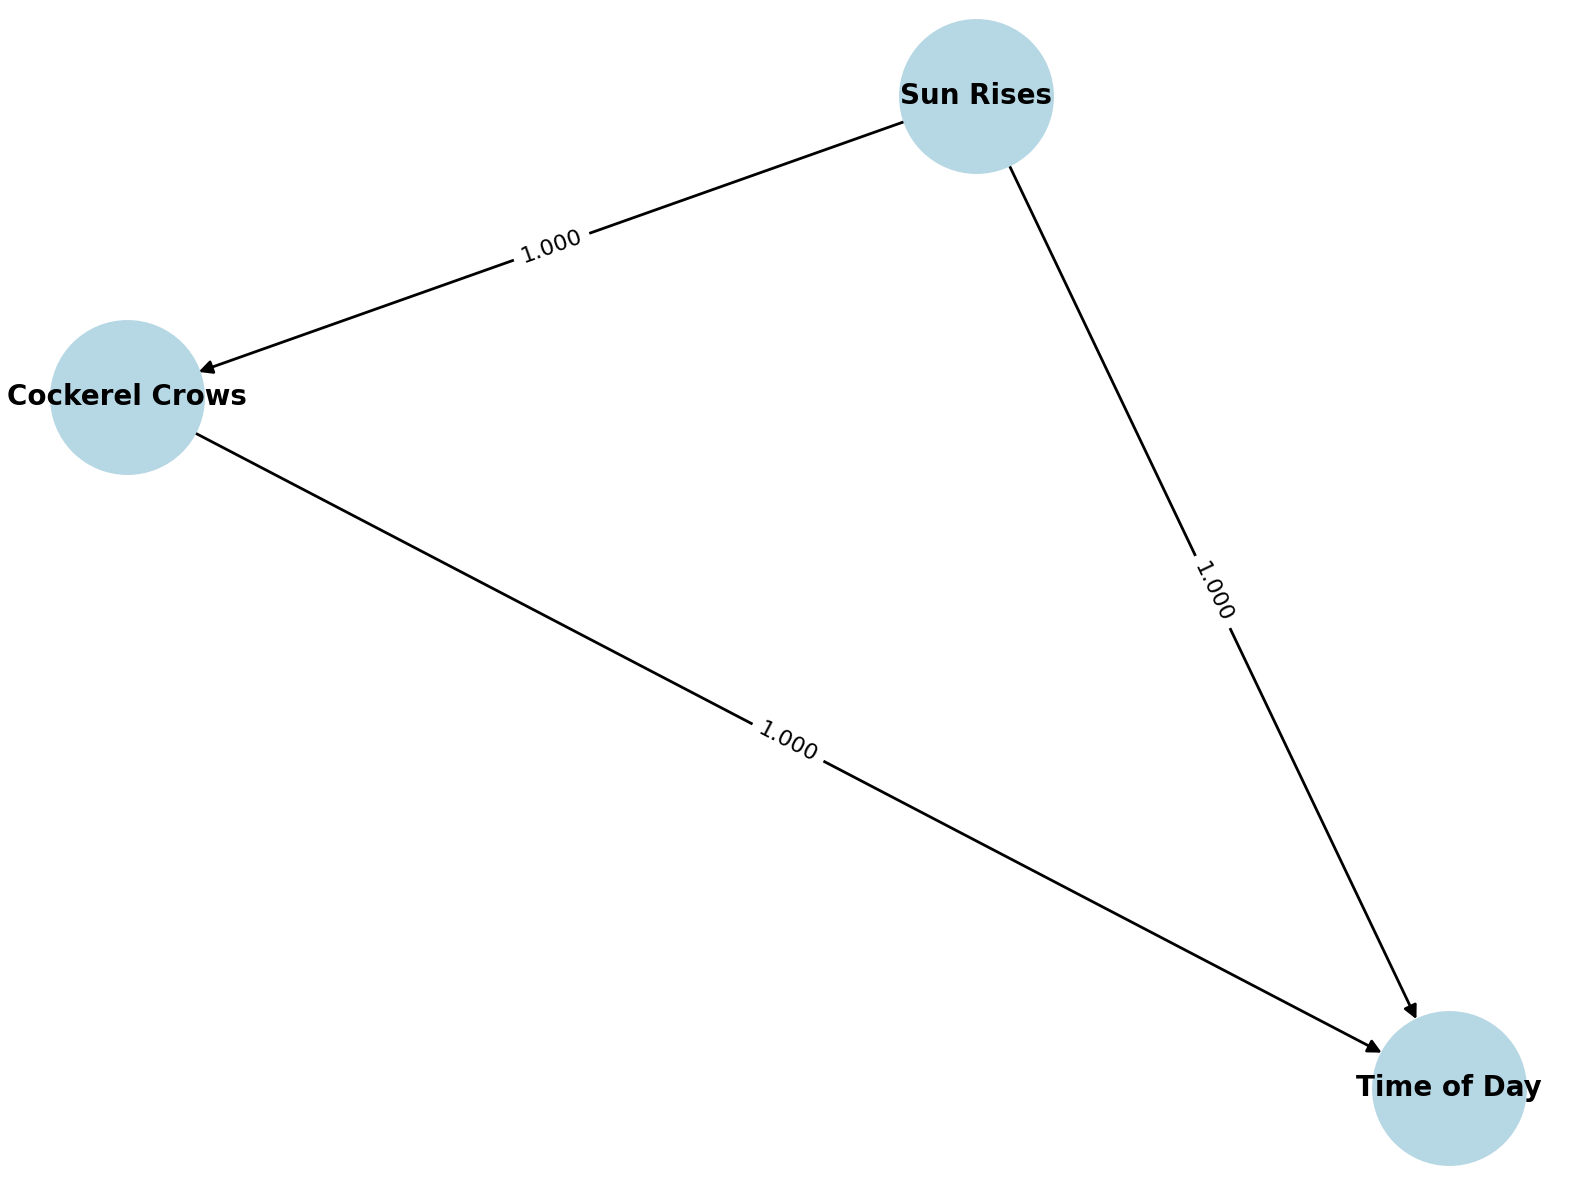
After running the algorithm, we obtain a causal graph. However, the YLearn algorithm fails to infer the correct causal relationships. While it identifies that sun_rising causes cockerel_crows, it incorrectly thinks that cockerel_crows and sun_rises causes time_of_day.
Testing Microsoft's Causal Discovery
Next, we try Microsoft’s causal discovery tool, Causica.
# Import causica library
from causica.datasets.causica_dataset_format import CAUSICA_DATASETS_PATH, DataEnum, load_data
from causica.datasets.tensordict_utils import tensordict_shapes
from causica.distributions import (
    AdjacencyDistribution,
    ContinuousNoiseDist,
    DistributionModule,
    ENCOAdjacencyDistributionModule,
    GibbsDAGPrior,
    JointNoiseModule,
    create_noise_modules,
)

# Get the current directory
current_dir = os.getcwd()

# Define the dataset folder name (change if needed)
dataset = "cockerel"

# Construct the root path relative to the current directory
root_path = os.path.join(current_dir, dataset)

variables_metadata = load_data(root_path, DataEnum.VARIABLES_JSON)
dataset_train: TensorDict = load_data(root_path, DataEnum.TRAIN, variables_metadata)
# move the entire dataset to the device, since it is small
dataset_train = dataset_train.apply(lambda t: t.to(dtype=torch.float32, device=device))

dataloader_train = DataLoader(
    dataset=dataset_train,
    collate_fn=lambda x: x,
    batch_size=training_config.batch_size,
    shuffle=True,
    drop_last=False,
)

num_nodes = len(dataset_train.keys())

prior = GibbsDAGPrior(num_nodes=num_nodes, sparsity_lambda=training_config.prior_sparsity_lambda)

# set up the adjacency matrix structure
adjacency_dist: DistributionModule[AdjacencyDistribution] = ENCOAdjacencyDistributionModule(num_nodes)


# TRAIN MODEL (Github for full code)

# extract adjacency matrix structure from trained model
vardist = adjacency_dist()
pred_adj_numpy = vardist.mode.cpu().numpy()

column_names = ['Sun Rises', 'Cockerel Crows', 'Time of Day']
adj_matrix = pred_adj_numpy

# Threshold for visualization (ignore very weak edges)
threshold = 0.1

# Create directed graph
G = nx.DiGraph()

# Add nodes to the graph with column names
G.add_nodes_from(column_names)

# Add edges based on adjacency matrix and threshold
for i in range(adj_matrix.shape[0]):
    for j in range(adj_matrix.shape[1]):
        if adj_matrix[i, j] > threshold:
            G.add_edge(column_names[i], column_names[j], weight=adj_matrix[i, j])

# Draw the graph with edge labels
pos = nx.spring_layout(G)  # Layout for better visualization
print(G)
plt.figure(figsize=(8, 6))
nx.draw(G, pos, with_labels=True, node_color='lightblue', node_size=3000, font_size=10, font_weight='bold', arrows=True)
edge_labels = nx.get_edge_attributes(G, 'weight')
edge_labels = {edge: f'{weight:.3f}' for edge, weight in edge_labels.items()}  # Format edge labels
nx.draw_networkx_edge_labels(G, pos, edge_labels=edge_labels, font_size=8)
plt.show()
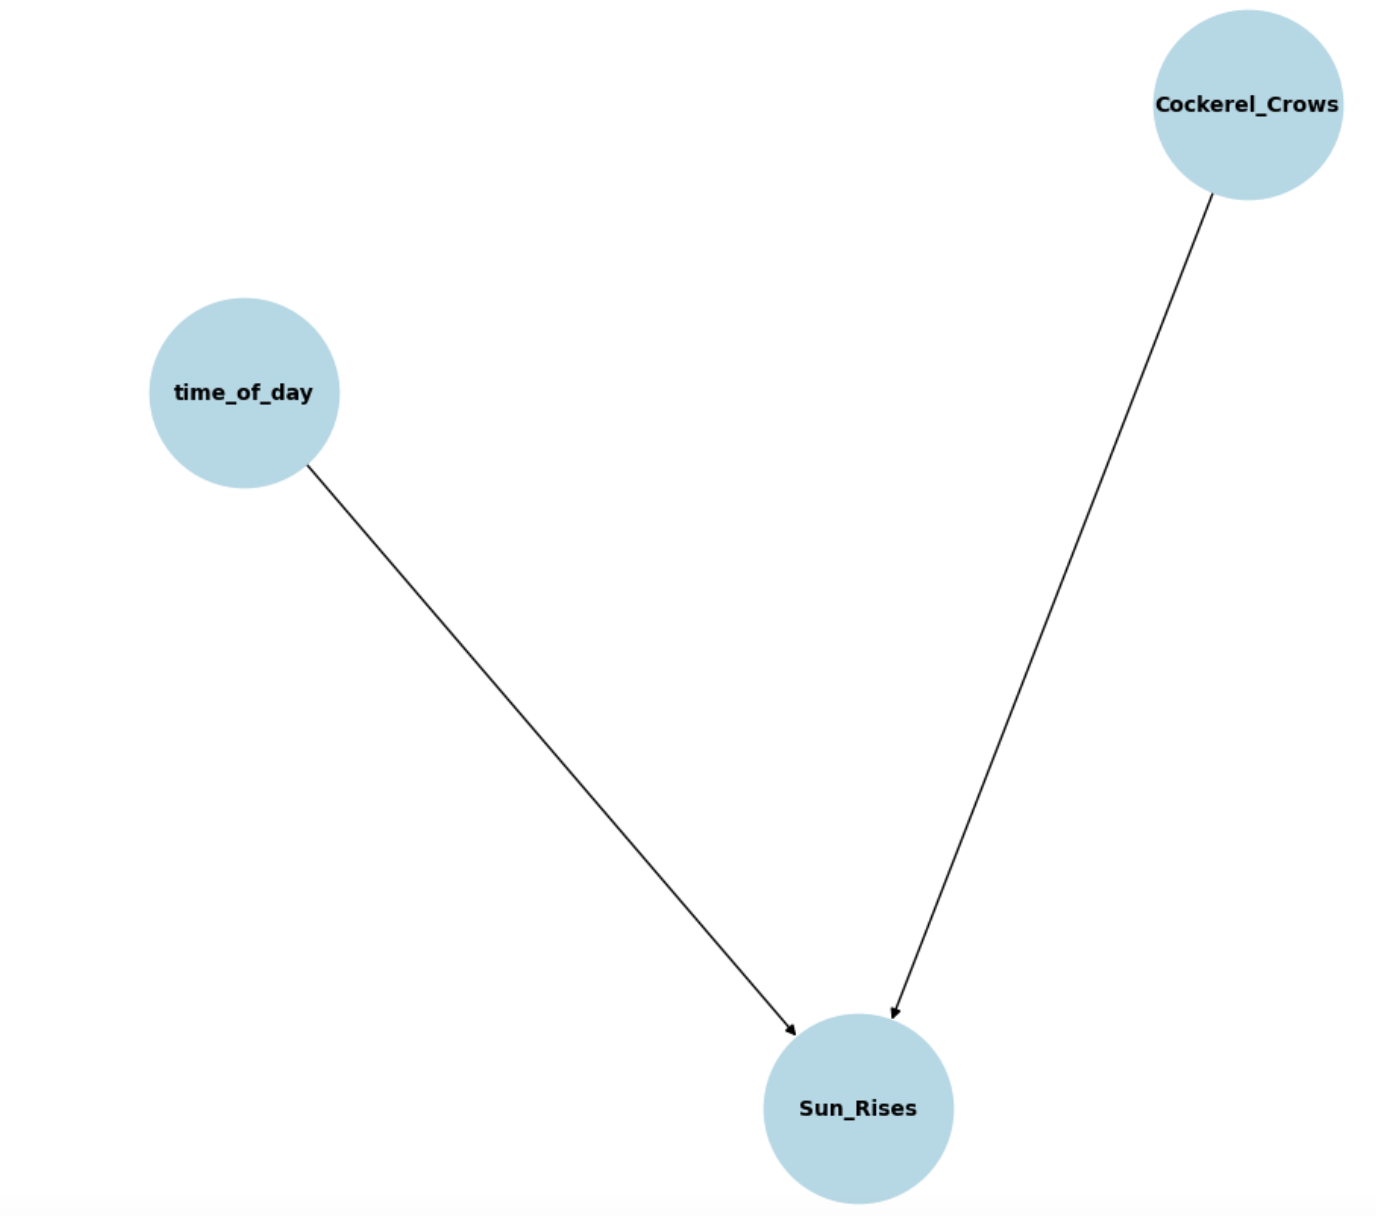
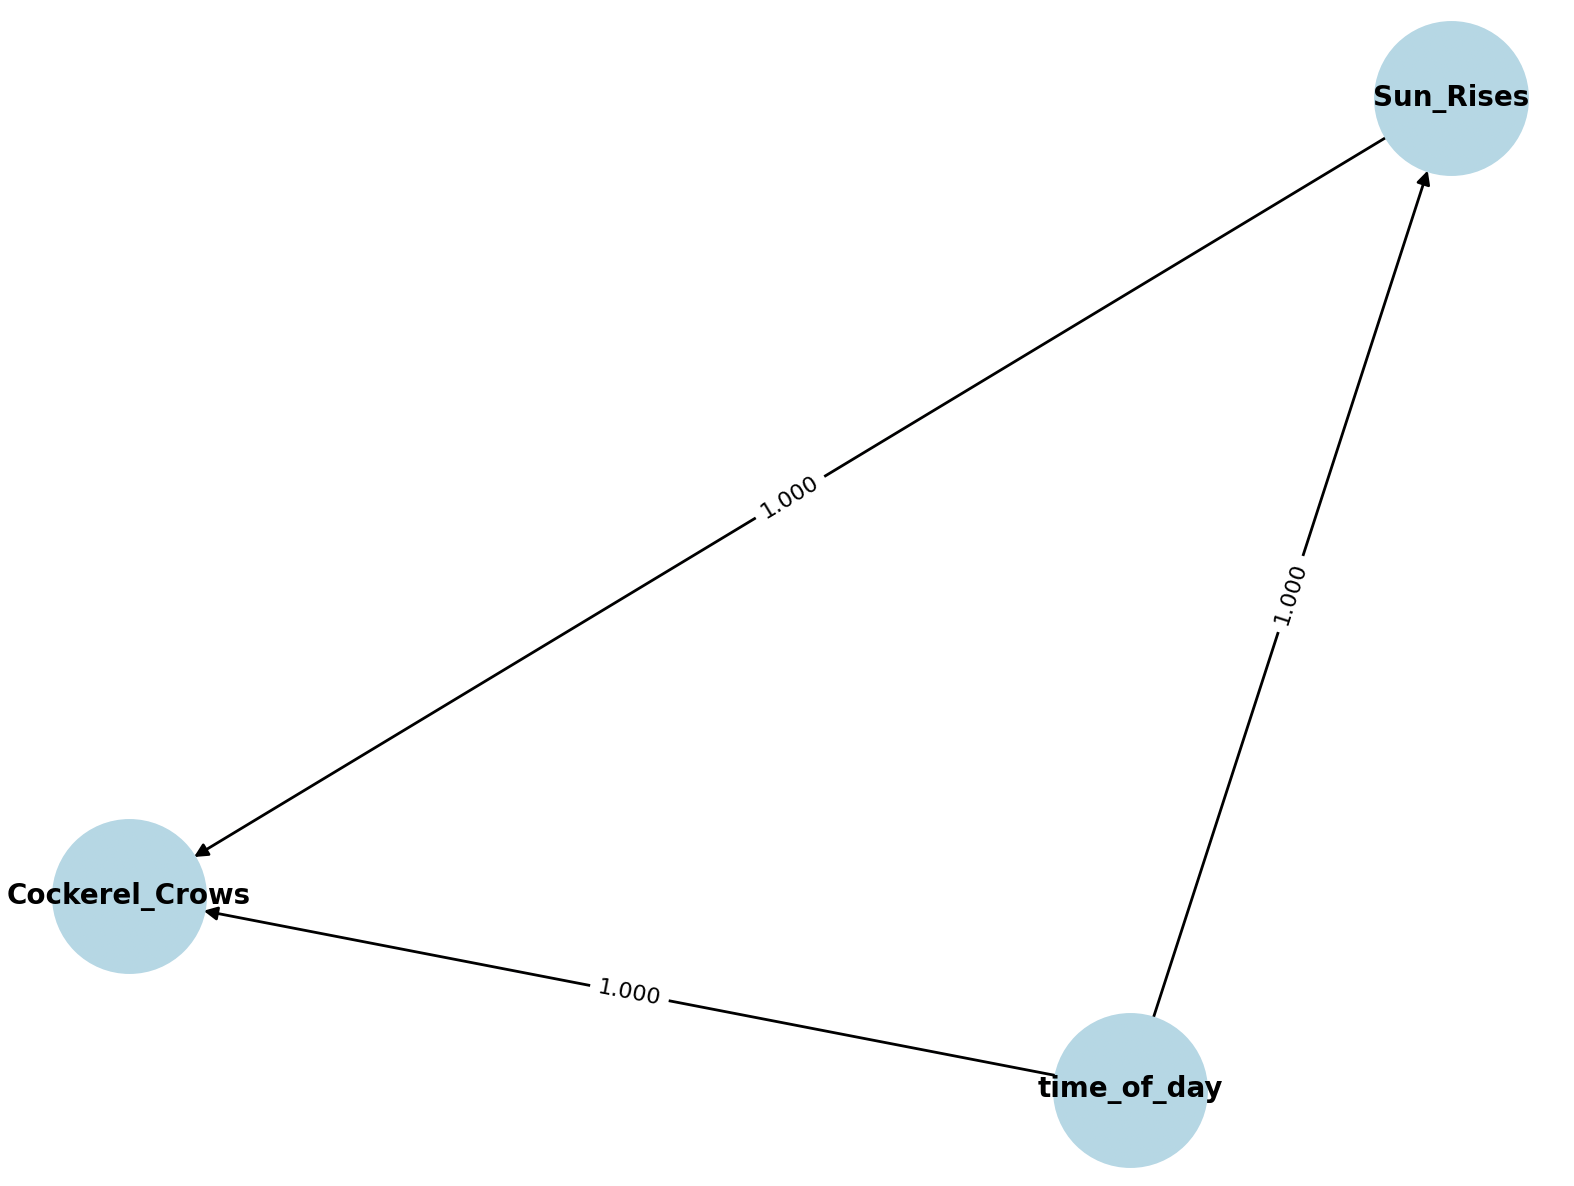
This time, the Causica algorithm learns the correct causal relationship between time_of_day and sun_rises but the incorrect, inverse relationship between cockerel_crows and sun_rises.
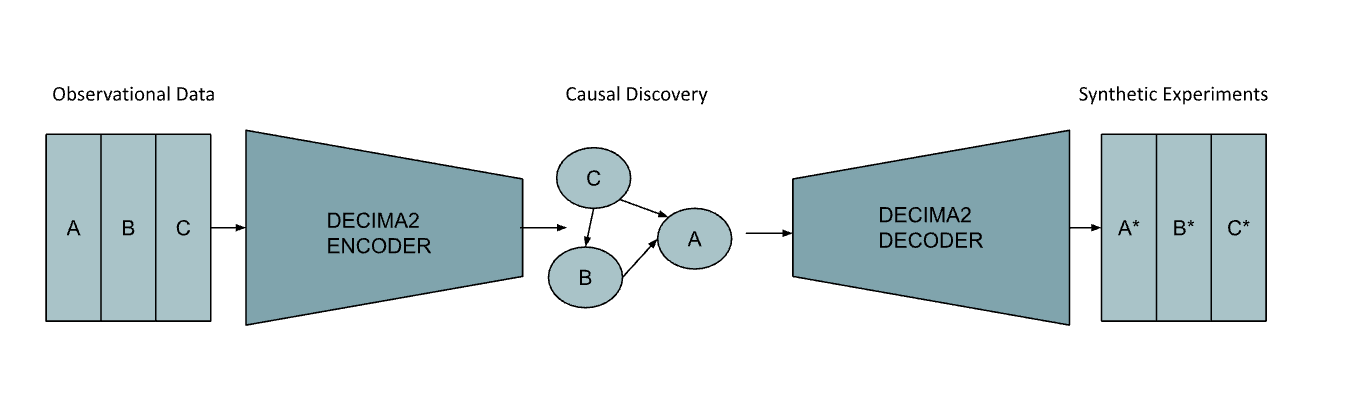
Decima2 For Causal Discovery
Finally, we use Decima2, our custom causal discovery tool.
# import relevant libraries

import decima2
import networkx
import matplotlib.pylot as plt
import networkx

# generate variational autoencoder and extract causal graph

df = pd.read_csv('cockerel.csv')

adj_matrix = decima2.causal_graph(df)
adj_matrix = threshold_matrix(adj_matrix)

column_names = df.columns

# Threshold for visualization (ignore very weak edges)
threshold = 0.1

# Create directed graph
G = nx.DiGraph()

# Add nodes to the graph with column names
G.add_nodes_from(column_names)

# Add edges based on adjacency matrix and threshold
for i in range(adj_matrix.shape[0]):
    for j in range(adj_matrix.shape[1]):
        if adj_matrix[i, j] > threshold:
            G.add_edge(column_names[i], column_names[j], weight=adj_matrix[i, j])

# Draw the graph with edge labels
pos = nx.spring_layout(G)  # Layout for better visualization
print(G)
plt.figure(figsize=(8, 6))
nx.draw(G, pos, with_labels=True, node_color='lightblue', node_size=3000, font_size=10, font_weight='bold', arrows=True)
edge_labels = nx.get_edge_attributes(G, 'weight')
edge_labels = {edge: f'{weight:.3f}' for edge, weight in edge_labels.items()}  # Format edge labels
nx.draw_networkx_edge_labels(G, pos, edge_labels=edge_labels, font_size=8)
plt.show()
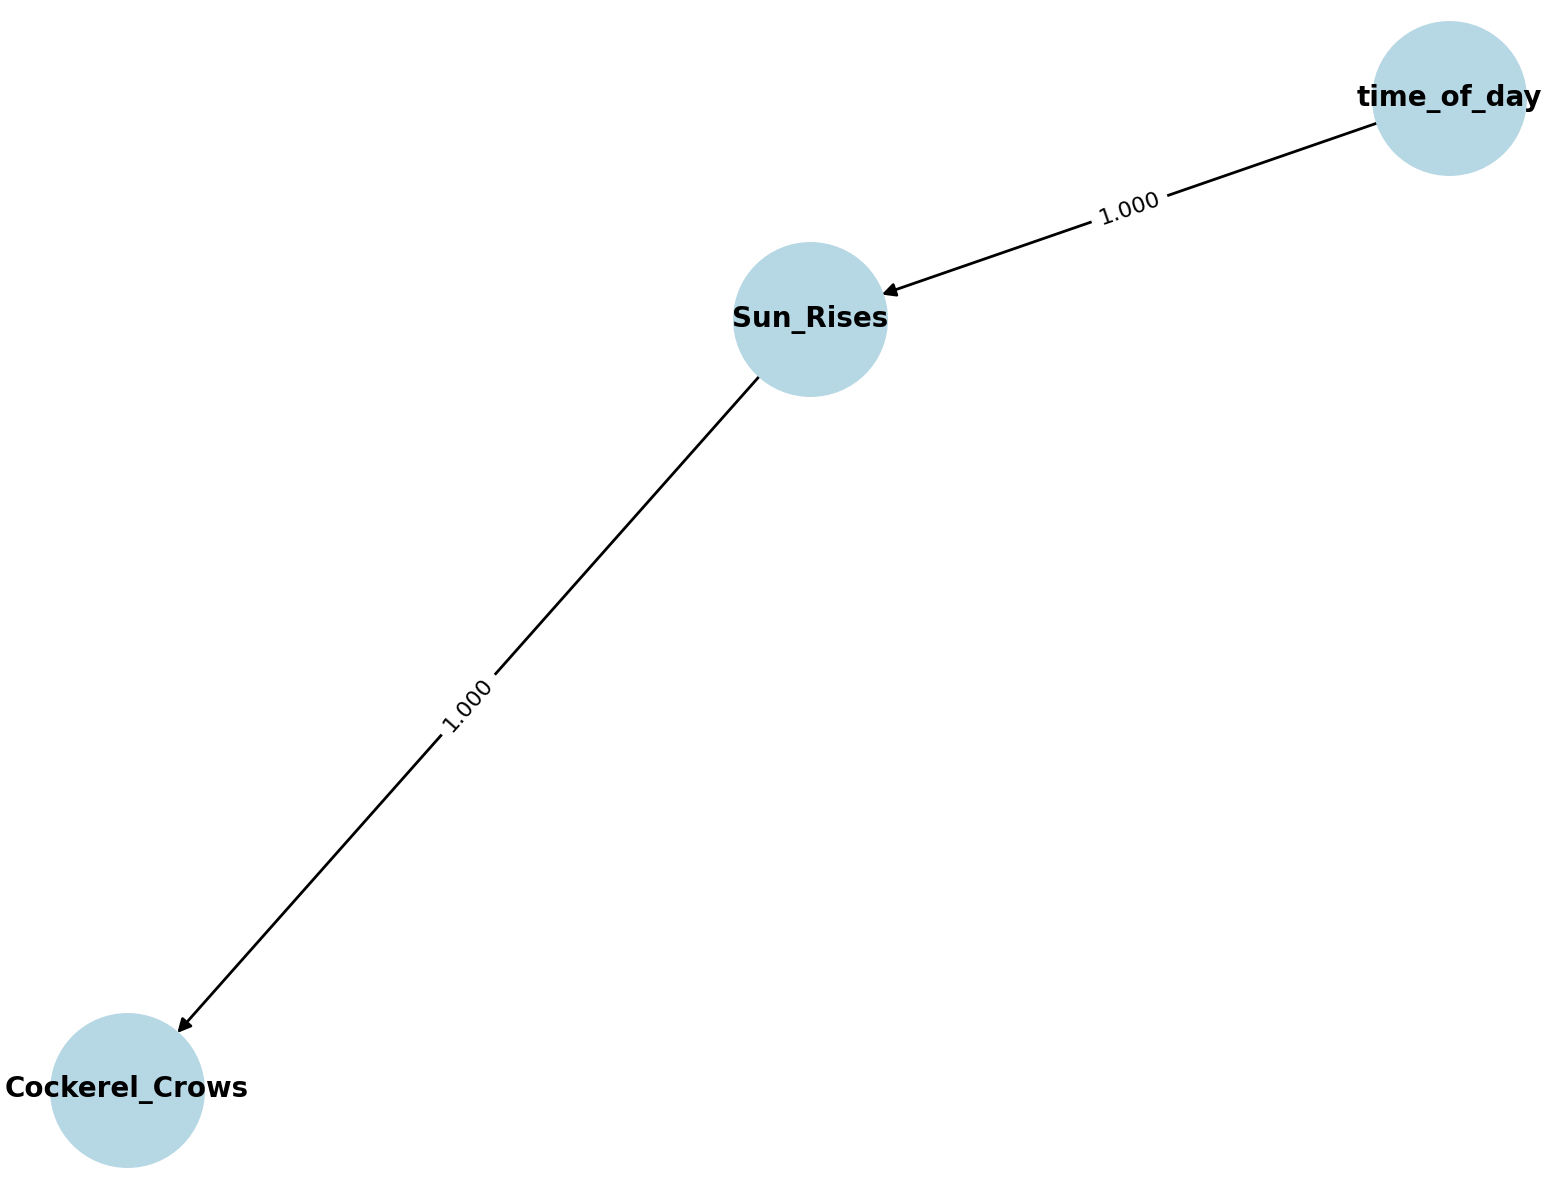
This time, we extract the correct causal structure:
Why Does Decima2 Succeed?
Decima2 leverages a groundbreaking Causal Variational Autoencoder (CVAE) that learns the latent causal structure in observational data. We have combined cutting-edge PhD research with real-world experiments to develop a “special causal sauce”: a model architecture that effectively handles imbalanced treatment.
As a result, Decima2 accurately infers that Sun_Rises → Cockerel_Crows and not the other way around.
Decima2 Can Perform Complex Causal Discovery
Adding Complexity to the Cockerel Example
In the real world, the reason a cockerel crows may be more complicated. What if the cockerel has a circadian rhythm, meaning it crows at 6 AM even if the sun hasn’t risen?
We modify our synthetic dataset to reflect this new causal structure, where time of day now has a direct causal effect on the cockerel crowing:
n = 1000  # Number of observations
np.random.seed(42)
time_of_day = np.random.uniform(4, 8, n)  # Time in hours (e.g., between 4 AM and 8 AM)
sun_rises = (time_of_day >= 6).astype(int)  # Sun rises at 6 AM

# Cockerel crows if sun rises (with some noise)
cockerel_crows = sun_rises * (np.random.rand(n) > 0.1).astype(int)  # 90% chance to crow if sun rises
new_cockerel_crows = []
for j,k in zip(cockerel_crows,time_of_day):
	if j == 0:
		if k >= 6:
			new_cockerel_crows.append(1 * (np.random.rand(1) > 0.5).astype(int)[0])
		else:
			new_cockerel_crows.append(j)
	else:
		new_cockerel_crows.append(j)

# Create DataFrame
df = pd.DataFrame({
    "Sun_Rises": sun_rises,
    "Cockerel_Crows": new_cockerel_crows,
    "time_of_day": time_of_day,
    #"Weather": temperature,


})

df.to_csv("cockerel.csv", index=False)
We use Decima2 to extract the causal graph. The result?
The generated causal graph correctly reflects the ground truth. Decima2 successfully discovers causal relationships even when they involve complex interactions.
Why is Causal Discovery So Important?
Understanding causality isn't just about cockerels and sunrises—it has real-world business applications:
-
What if we discovered that discounts don’t actually impact customer churn?
-
What if a new website feature actually increases click-through rates, contrary to our initial assumptions?
These insights could revolutionize decision-making in business, healthcare, economics, and beyond.
Start Extracting Causal Graphs Today
Full code for the cockerel causal demo is available on GitHub
Decima2 provides state-of-the-art causal discovery capabilities. With our easy-to-use API, you can start uncovering hidden causal relationships in your own data today.
Sign up now for your API key and start extracting causal insights today!